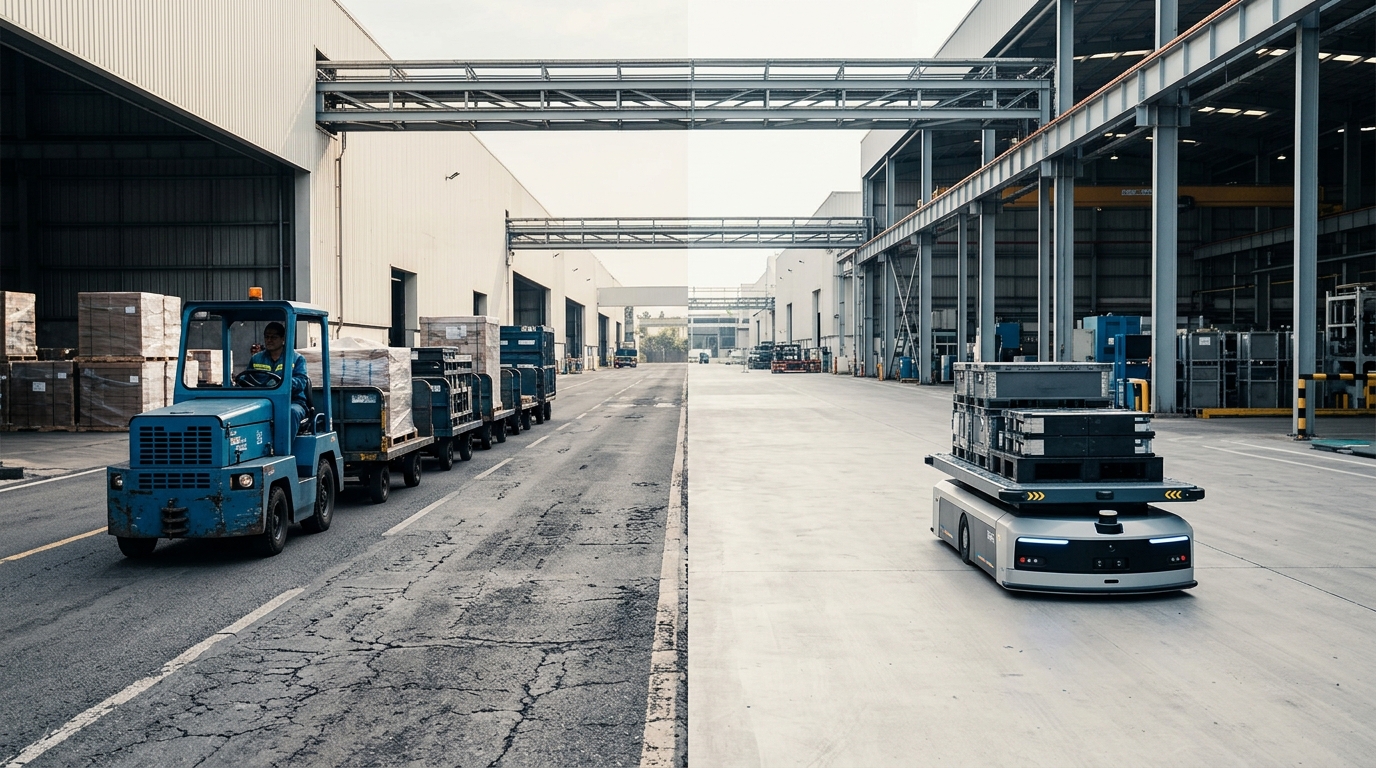
Outdoor AMR vs. Tugger Fleet: Total Cost of Ownership
Discover the complete total cost of ownership for outdoor AMRs versus traditional tugger fleets, including labor, maintenance, and leasing structures.
Building a business case for outdoor mobile robots requires more than comparing purchase prices. This guide breaks down the total cost of ownership for autonomous fleets versus traditional tuggers, from hidden implementation fees to labor restructuring and ROI timelines.
Key Takeaways
- 1Evaluating autonomous fleets requires factoring in a substantial premium for engineering and implementation on top of hardware -- often comparable in magnitude to the hardware line item itself.
- 2Leasing outdoor mobile robots preserves cash flow, with monthly payments substituting traditional driver wages.
- 3Automated systems typically deliver over 95 percent uptime, drastically cutting the hidden costs of manual forklift delays.
- 4Well-scoped outdoor autonomous integrations generally achieve full payback within 18 to 24 months.
- 5Annual maintenance contracts for autonomous fleets average 5 to 10 percent of the total equipment value.
The Hardware and Implementation Capex
When evaluating the capital expenditure required to move horizontal loads across industrial yards and manufacturing campuses, procurement teams frequently make the mistake of evaluating bare equipment sticker prices in isolation. A standard industrial manual tugger tractor sits at the lower end of the material handling price scale, with cost driven by towing tonnage, chassis ruggedization, and cab weatherproofing. Automated towing and tugger vehicles, by comparison, start at around $50,000 per unit depending on the navigation system and whether the platform is semi-automated or fully automated. On paper this creates an apparent hardware cost premium for outdoor AMRs, leading traditional equipment buyers to hesitate before examining the broader financial architecture.
Accounting for the 30 Percent Implementation Rule
A complete capital evaluation must factor in the non-hardware deployment costs necessary to achieve production readiness. In enterprise robotics deployments, finance models should budget a substantial additional line item -- commonly on the same order of magnitude as the hardware cost itself -- for software integration, site mapping, network validation, and system commissioning. For manual tugger fleets, implementation overhead is comparatively negligible, consisting primarily of driver onboarding and basic route signage. For autonomous systems, implementation covers optical and LiDAR site surveys, fleet controller configuration, and enterprise software handshakes.
| Capex Component | Manual Tugger Fleet (Illustrative) | Autonomous Outdoor AMR Fleet (Illustrative) |
|---|---|---|
| Base Vehicle Hardware (per unit) | Lowest capital entry point | Higher per-unit capital, scaling with navigation and payload |
| Implementation & System Integration | Minimal (driver onboarding and route signage) | Substantial share of hardware value for engineering and commissioning |
| Fleet Management & Dispatch Software | None (paper or radio dispatch) | Fleet controller and server setup as a separate line item |
| Site Preparation & Safety Mapping | Negligible | Environment digitization & geofencing |
Treating implementation as a distinct capital line item clarifies the true starting baseline. While autonomous hardware and engineering carry a higher day-one commitment, treating these outlays as depreciable capital assets creates the foundation for structural operational savings across subsequent operational cycles.
Financing Structures: Leasing vs. Buying
Choosing between an outright capital purchase and a structured operating lease fundamentally alters the net present value (NPV) and cash flow profile of an intralogistics upgrade. An outright cash purchase grants immediate asset ownership and avoids interest carrying costs, but it ties up substantial working capital that could generate higher returns in core manufacturing or facility expansion projects. Furthermore, buying outright leaves the enterprise carrying 100 percent of the technology obsolescence risk in a market where sensor technology and compute capabilities evolve rapidly.
The Fair Market Value (FMV) Lease Advantage
To align project cash outflows directly with ongoing operational cost reductions, most enterprise operators deploy automated fleets through 48 to 60 month lease structures. Under a Fair Market Value (FMV) operating lease, payments are calculated against the expected asset depreciation over the term rather than the total initial purchase price. For towing AMRs, that structure converts a large initial capital hurdle into a predictable monthly operating expense that can be compared directly against the driver payroll it displaces.
- Outright Purchase: High upfront capital drain, multi-year balance sheet amortization, full residual risk placed on the buyer, and longer payback recovery windows.
- Fair Market Value (FMV) Lease: Predictable 48 to 60 month operating payments, payments structured strictly against depreciation, and built-in flexibility to refresh vehicle fleets at end of term.
- Robot-as-a-Service (RaaS): Variable operational cost tied to operating hours or moved pallets, suitable for standard light-duty logistics but rarely offered with custom outdoor heavy-tow configurations.
Because autonomous mobile robots execute precise acceleration curves and obey strict collision avoidance protocols, they experience significantly lower structural fatigue than manually operated tractors. Financing institutions recognize this operational durability, assigning higher residual values to automated equipment and lowering monthly lease rates across 48 to 60 month commitments.
Labor Cost Restructuring
Labor represents the single largest recurring expenditure in industrial yard logistics. A manual tugger requires a dedicated, certified operator for every hour of active service. In multi-shift operations spanning two or three daily shifts, an organization must budget multiple full-time equivalent (FTE) drivers per vehicle to account for shift rotations, mandated rest breaks, paid time off, and absenteeism. Benefits, payroll taxes, and statutory contributions add a substantial margin on top of an operator's base salary, so the fully loaded cost of a driver position per shift runs well above the headline wage.
Supervision Ratios and Multi-Shift Leverage
Transitioning to autonomous haulage restructures the operational labor model from dedicated vehicle drivers to supervisory fleet oversight. Instead of a 1:1 driver-to-vehicle ratio, a single trained technician monitors several autonomous units at once from a real-time dispatch console, stepping in only for exceptions. This ratio shift unlocks compounding labor cost reduction as daily operating hours increase.
| Operating Horizon | Manual Tugger (1 Driver per Unit) | Outdoor AMR Fleet (Supervisory Model) | Annual Labor Variance (Illustrative) |
|---|---|---|---|
| Single shift | 1.0 driver FTE, fully loaded | A fraction of one supervisory FTE, shared across the fleet | Most of one fully loaded driver position recovered |
| Double shift | 2.0 driver FTEs, fully loaded | A fraction of one supervisory FTE per shift, shared across the fleet | Roughly two driver positions recovered |
| Three shifts (continuous 24/7) | Just over 3 driver FTEs, fully loaded | Under half a supervisory FTE per shift, shared across the fleet | Roughly three driver positions recovered |
Beyond baseline hourly wages, manual fleet operations face persistent employee turnover costs. Warehouse and logistics turnover rates often exceed 40 percent annually, and recruiting, vetting, and training each replacement equipment operator incurs substantial recurring friction. Autonomous systems permanently eliminate driver onboarding churn for standard horizontal routes.
Maintenance and Unplanned Downtime
Maintaining an industrial fleet involves continuous expenditure on mechanical wear items, scheduled fluid changes, hydraulic inspections, and unscheduled breakdown repairs. Manual tuggers are subject to aggressive driver habits, including abrupt directional shifting, over-throttling, curb impacts, and cornering stresses. Over a standard five-year operating lifecycle, maintenance and repair on manually driven lift and tow equipment becomes one of the larger recurring cost lines, and it grows less predictable as the fleet ages.
Predictive Servicing and Operational Availability
Autonomous outdoor vehicles follow electronically governed speed ramps, smooth steering trajectories, and algorithmic braking profiles that significantly reduce mechanical shock loads on drivetrains, differentials, and tires. Because every cycle runs at the same optimised speed rather than varying with operator fatigue, automated fleets in structured industrial workflows sustain high operational availability across shifts. Routine maintenance for AMRs centers primarily on sensor cleaning, firmware validation, tire tread wear checks, and battery health telemetry.
- Mechanical Stress Profile: Manual tuggers suffer high shock loads from erratic driving, whereas AMRs maintain strictly regulated torque curves and controlled braking.
- Preventative Servicing: AMRs utilize onboard telemetry and operational logs for predictive component replacement, avoiding catastrophic in-service mechanical breakdowns.
- Annual Maintenance Budget: AMR service contracts and routine component replacements are contracted in advance, which converts an unpredictable repair line into budget certainty.
- Fleet Availability: High system reliability and automated error recovery enable autonomous fleets to hold planned availability across multi-shift schedules.
The financial penalty of unscheduled equipment downtime extends far beyond repair invoices. In just-in-time manufacturing and high-throughput cross-docking environments, a stalled tugger train that starves an assembly line or delays outbound trailers can generate downtime losses running into thousands of dollars per idle hour. Reliable automated dispatch removes erratic mechanical failure points from critical material paths.
Charging and Energy Infrastructure
Transitioning to outdoor electric autonomous fleets requires careful planning of energy and facility infrastructure. While traditional electric tuggers are routinely returned to dedicated battery rooms for manual plug-in or overhead battery swaps at shift changeover, autonomous mobile robots rely on distributed, automated opportunity charging stations integrated directly along their operational paths.
Facility Upgrades and Battery Lifecycle Budgeting
Procurement models must account for the initial capital required to install industrial-grade, weather-rated outdoor docking stations. Establishing automated fleet charging infrastructure involves dedicated three-phase electrical drops, concrete pad foundation work, weatherized protective canopies, and automated contact plates or inductive charging pads.
- Charging Hardware & Enclosures: High-amperage, weatherized charging docks engineered for outdoor environmental protection ratings (IP65 or higher).
- Electrical Distribution Upgrades: Dedicated sub-panels, conduit routing, and circuit protection installed near major transfer points or buffer zones.
- Opportunity Charging Software: Intelligent fleet algorithms that schedule top-up charging sessions during natural dwell times, keeping fleet state-of-charge within optimal 20 to 80 percent bands.
- Battery Replacements: Lithium iron phosphate (LFP) packs typically deliver 2,000 to 5,000 full cycles before capacity falls below 80 percent of rating, so planned replacement should be budgeted into the ownership model.
Although fast-charging infrastructure introduces an upfront capital line item, automated opportunity charging eliminates the dedicated labor hours and specialized hoist equipment required for manual battery swaps. AMRs autonomously return to charging pads during idle windows, ensuring high vehicle availability throughout extended operating shifts.
Insurance and Risk Mitigation
Industrial vehicle transport inside crowded facilities and across active outdoor yards creates substantial safety and liability exposure. Heavy manual tuggers pulling loaded trailer carts through shared pedestrian zones, blind intersections, and exterior loading bays present recurring collision risks. In the United States alone, the Occupational Safety and Health Administration (OSHA) notes that employers pay nearly $1 billion per week in direct workers' compensation costs for workplace injuries.
Direct Claims versus Uninsured Indirect Losses
When industrial equipment accidents occur, direct insurance payouts for medical expenses and workers' compensation represent only part of the total financial liability. OSHA notes that the cost of workplace injuries also includes indirect costs such as accident investigation and corrective measures, repairs of damaged equipment and property, lost productivity, training replacement employees, and absenteeism. Autonomous outdoor robots operate with 360-degree sensor coverage, fail-safe safety PLCs, and deterministic braking zones, sharply reducing collision risk during outdoor material transfer.
| Risk & Liability Factor | Manual Tugger Operation | Autonomous Outdoor AMR Fleet |
|---|---|---|
| Collision & Blind-Spot Incidents | Dependent on human driver focus and visibility; elevated incident rates in adverse weather | Deterministic 360-degree LiDAR and radar obstacle detection; automated safety stops |
| Facility & Infrastructure Damage | Frequent low-speed impact with bollards, bay doors, and trailer corners | Virtual geofencing and zero-contact navigation eliminate structural impacts |
| Workers' Comp & Liability Premiums | High risk tier driven by vehicle incident history and claim reserves | Fewer recordable incidents support a lower risk classification and smaller loss reserves |
| Product & Cargo Scrappage | Cargo jostling from sudden driver braking and over-speed turns | Strict acceleration limits and controlled turning radii protect transported cargo |
By eliminating driver-related facility strikes, gate impacts, and dropped load incidents, companies significantly reduce their recurring loss ratios. Over a multi-year horizon, lower commercial insurance claim volume and reduced property damage directly protect operating margins.
Depreciation, Residual Value, and ROI Timeline
The complete total cost of ownership model brings together capital hardware, software implementation, recurring labor, preventative maintenance, energy infrastructure, and risk mitigation over a comprehensive 5-year investment horizon. While manual tuggers feature lower upfront capex, their ongoing operational profile is burdened by heavy annual labor commitments, erratic maintenance spikes, and rapid mechanical depreciation. In contrast, an outdoor AMR fleet represents a stable, depreciable asset base whose controlled operating envelope helps preserve mechanical condition across the lease or ownership term.
The 18 to 24 Month Payback Horizon
When deployed in multi-shift manufacturing or logistics operations, the reduction in driver headcount and unbudgeted collision repairs drives capital payback quickly: tugger AGV suppliers report that most customers can expect a return on their investment within 18 to 24 months. Operations running continuous double or triple shifts sit at the faster end of that range, as recurring labor savings quickly overtake initial implementation and infrastructure investments.
- Multi-Shift Labor Displacement: Removing the dedicated driver from each vehicle line across two or three shifts recovers several fully loaded driver positions per deployed autonomous unit each year.
- Asset Value Retention: Controlled mechanical operating envelopes preserve chassis and drive components, supporting strong end-of-term lease buyout or secondary market residual valuations.
- Structured Implementation Governance: Standardized operational workflows and pre-verified deployment blueprints eliminate extended engineering delays and keep capital budgets on schedule.
- Predictable Total Ownership Cost: A 5-year TCO model demonstrates lower net cumulative expenditure for automated towing fleets compared to continuously rising manual driver payroll.
Achieving this rapid return on investment requires precise architectural alignment across hardware, site infrastructure, and enterprise systems. Engaging an experienced robotics systems integrator enables finance and operations leaders to de-risk adoption. As an independent systems integrator, werob specifies, sources, and deploys verified autonomy kits and vehicle platforms from trusted OEM partners, connecting hardware directly into ERP and warehouse workflows via pre-built Connectors while managing fleet health and SLA compliance through Cockpit.
Running this TCO math for your own fleet means matching illustrative ranges to your actual site conditions, shift patterns, and financing options. werob helps outdoor and industrial operators specify, source, and integrate AMR fleets from vetted OEM partners, so the TCO case gets built on real vendor quotes rather than industry averages.
Read more: Replacing the tugger train: specifying and sourcing outdoor AMRs · Robot fleet charging: autonomous infrastructure · What a robotics systems integrator actually does.
FAQ
- How much does implementation add to the total cost of ownership?
- Beyond the raw hardware price, operations should budget a substantial additional line item -- commonly on the same order of magnitude as the hardware cost itself -- for engineering, mapping, and system integration to ensure a successful outdoor deployment.
- What is the typical payback period for an autonomous outdoor fleet?
- When properly scoped and deployed across multiple shifts, tugger-class automated vehicles generally achieve full financial payback within 18 to 24 months.
- How do maintenance costs compare between autonomous robots and manual tuggers?
- While traditional tuggers suffer from mechanical wear and tear, automated systems are highly predictable. Annual maintenance for autonomous fleets typically averages 5 to 10 percent of the total equipment value.
- Why is leasing popular for autonomous industrial vehicles?
- Leasing shifts a large capital expense into predictable monthly operational costs, removing the initial cash flow hurdle and aligning the 48 to 60 month terms with technology upgrade cycles.
- Does autonomous equipment reduce facility downtime?
- Yes, automated mobile platforms operate consistently without breaks or driver errors, typically maintaining over 95 percent operational uptime and minimizing workflow disruptions.
- Are charging stations included in the base hardware price?
- Charging infrastructure and necessary electrical upgrades are usually separate line items in the total cost of ownership and must be factored into the overall project capital.
Related reading
Replacing the Tugger Train: Specifying and Sourcing Outdoor AMRs
Intralogistics leaders are replacing manual tugger trains with outdoor AMRs to combat labor shortages and safety incidents. Discover how to specify the right navigation and payload architectures while ensuring compliance with ISO 3691-4 and EU Machinery Regulation 2023/1230.
13 August 2026robot fleet charging infrastructureRobot fleet charging: Autonomous infrastructure
Charging infrastructure directly determines how large an AMR fleet needs to be and how available it stays in continuous operation. This guide breaks down charging-cycle planning, battery technologies, and redundancy concepts without committing to any one charging system.
14 August 2026outdoor agv replacementOutdoor AGV Replacement: Evaluating the Shift to AMRs
Replacing legacy fixed-path outdoor AGVs with dynamic AMRs requires a shift from hardware decisions to systems integration. werob offers an eight-week phased migration, evaluating over 44 OEMs to deploy flexible, autonomous fleets under an outcome-only payment model.
13 August 2026automated stocktaking robot costThe real cost of a stock count
A manual stock count shuts operations down, ties up staff for days, and still comes with an error rate. The real cost centre isn't the counting itself — it's the standstill around it.
11 September 2026offshore wind maintenance turbine access costOffshore Wind Maintenance: The Real Cost of Turbine Access
1,764 offshore wind turbines with roughly 10.8 GW stand in German waters. Every maintenance job starts with the same question: how does someone reach the turbine safely without burning a weather window.
18 September 2026