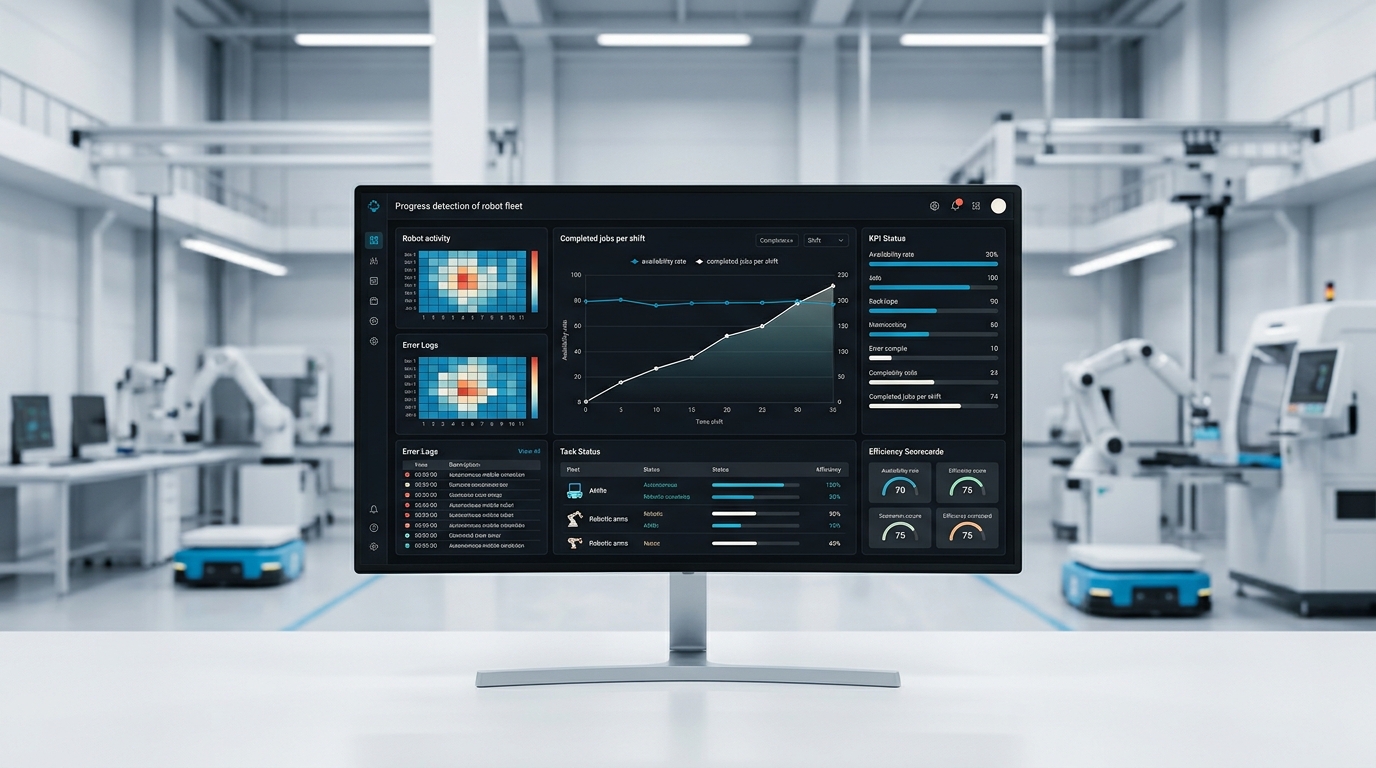
Progress detection as an operating metric: from robot availability to completed jobs
The quietest capability in the ER 2 release is the ability to tell whether a task actually finished. That changes which number belongs on the operations dashboard, and it is not uptime.
Ask most operators how their robot fleet performed last month and you will get an availability figure. It is the wrong number, and everyone involved half knows it. A machine can be powered, connected and available for an entire shift while completing a fraction of its assigned work, and the availability dashboard will show green throughout. The new capability in Gemini Robotics ER 2 is that a system can now form a defensible opinion about whether a task actually finished. That makes a better metric possible, and it deserves to be read with its limitations attached.
Key Takeaways
- 1Availability measures whether a machine could work. Completed jobs measure whether it did. Only the second correlates with what an operator is paid for.
- 2ER 2 reports 91.3 percent accuracy on moment finding with a mean absolute distance of 0.96 seconds, and 57.4 percent on continuous progress classification.
- 357.4 percent is a research result, not an unattended supervisor. It means a human still confirms outcomes, and the honest framing is that detection changes what people do rather than removing them.
- 4In facility work an unnoticed failure costs more than a slow success, because the consequence surfaces somewhere else and later.
Why availability flatters a fleet
Availability came into robotics from fixed industrial automation, where a machine bolted to a floor performing one motion has a genuinely meaningful uptime figure. If it is running, it is producing. The metric travelled to mobile service robots without anyone checking whether the assumption travelled with it.
It did not. A mobile robot in a building can be fully available and still achieve nothing, because the ways it fails are situational rather than mechanical. It waits for a lift that never grants it priority. It stops at a fire door it cannot open. It cleans an area it already cleaned because its map drifted. It completes a transport to the wrong staging point. Every one of those is a fully available machine, and the dashboard shows green through all of them.
This is the actual reason robot deployments disappoint after the pilot. Not because the machines break, but because nobody was measuring completion, so the gap between assigned and finished work stayed invisible until someone noticed the cleaning had not improved.
What ER 2 adds, and what the numbers really say
ER 2 continuously monitors a video feed and reasons about whether a task is progressing and when it is done. Two published figures describe how well.
- Moment finding: 91.3 percent, with a mean absolute distance of 0.96 seconds. Given a video and a critical event, the model identifies the right frame about nine times in ten, on average within a second.
- Continuous progress classification: 57.4 percent. Judging on a rolling basis how far along a task is.
The second number deserves to be stated plainly rather than buried, because it is the one that determines staffing. At 57.4 percent, continuous progress classification is better than previous models and competing frontier models, and it is nowhere near sufficient to run unattended. A supervising human is still required. Anyone presenting this capability as autonomous quality assurance is misreading the benchmark.
What it is good enough for is triage. Moment finding at 91.3 percent means a system can reliably point a person at the ten seconds of video where something went wrong, instead of asking them to watch a shift. That is a genuine change in the cost of supervision, and it is a smaller claim than the one usually made.
The metric that replaces availability
What an operator is actually paid for is completed work, so the dashboard should report completed work.
| Instead of | Report | Because |
|---|---|---|
| Availability in percent | Completed jobs per shift | An available machine that finished nothing is a failure the first metric cannot see |
| Operating hours | Area cleaned or transports delivered | Hours are an input, not an outcome |
| Number of faults | Exceptions per shift and time to resolution | Resolution cost drives staffing, fault count does not |
| Fleet size | Share of assigned work completed unaided | This is the number that tells you whether to expand |
The fourth row is the one that changes procurement decisions. If a fleet completes 70 percent of assigned work without help, doubling the fleet does not double the outcome, it doubles the exceptions. Fixing the causes of the missing 30 percent, which are usually lifts, doors and staging points rather than robots, is nearly always the better investment.
The handover is the product
Once a system can flag that a task failed and roughly when, the interesting design question is what happens next. This is where deployments are won or lost, and it is organisational rather than technical.
A useful exception path answers four questions: who is told, how quickly, with what context, and what happens to the rest of the plan. A notification with no context makes someone walk to the machine to find out what is wrong, which costs more than the failure did. A notification that arrives with the relevant few seconds of video and the machine's own account of what it was attempting lets the same person decide from where they are standing.
Equally important is that the fleet keeps going. An exception on one machine should reroute adjacent work rather than stalling the queue behind it. Most disappointing pilots fail here, not at the perception layer.
The broader case for people, robots and software agents sharing one order book, rather than running as separate systems, is set out on our mixed workforce page.
What to put in place
None of this requires the new model. Progress detection makes it cheaper, but the discipline is available now with the machines already installed.
- Log assigned jobs and completed jobs separately, per shift and per area. The gap between them is your actual performance number.
- Record the reason for every exception in a fixed vocabulary. Free text cannot be counted, and after three months the counts are what tell you where to invest.
- Measure time from exception to resolution, not just the count. That figure sets staffing.
- Report the share of assigned work completed unaided as the headline metric to management, with availability demoted to a diagnostic.
- Decide who owns exceptions on each shift. An unowned exception queue is how a fleet quietly stops working.
Where video is used to determine progress, raise codetermination early. Camera-based monitoring in German-speaking workplaces engages section 87 paragraph 1 number 6 of the Works Constitution Act on technical monitoring equipment, and it is far easier to design retention and masking in at the start than to retrofit them after an objection.
werob integrates and operates multi-vendor fleets for building operators, which mostly means making unglamorous things like exception vocabularies work. The console demo shows how the fleet, mission and exception views fit together.
FAQ
- Why is robot availability a poor metric?
- Because a mobile robot fails situationally rather than mechanically. It can be powered, connected and fully available while waiting for a lift, stopping at a door it cannot open or cleaning the wrong area. Availability shows green through all of those, so the gap between assigned and completed work stays invisible.
- What do the 91.3 and 57.4 percent figures mean?
- Moment finding at 91.3 percent means the model identifies the video frame where a critical event occurred about nine times in ten, on average within 0.96 seconds. Continuous progress classification at 57.4 percent means judging on a rolling basis how far along a task is, which is better than previous models but far from sufficient to run unattended.
- Does progress detection remove the need for supervising staff?
- No, and claims otherwise misread the benchmark. At 57.4 percent on continuous progress classification a human still confirms outcomes. What changes is the cost of supervision: moment finding at 91.3 percent can point a person at the relevant seconds of video instead of requiring them to watch a shift.
- Which metric should replace availability on the dashboard?
- The share of assigned work completed without human help, per shift and per area, alongside exceptions per shift and time to resolution. That combination tells you whether expanding the fleet will help, which an availability figure never does.
Related reading
Forty minutes a day: what the world's largest robot fleet publishes about its own utilisation
Brain Corp reports over 50,000 robots and 5.3 million autonomous hours in half a year. Divided by robots and days, that leaves just under forty minutes. It is not a criticism of the fleet — it is the number that belongs on the dashboard after month three, and the reason is in a Kärcher datasheet.
11 September 2026feed pushing robot dairy barn€9.30 per cow per year: what a feed-pushing robot actually changes in the barn
A state research institute priced the robot against the yard tractor and landed on almost the same figure. The difference is not the cost. It is whether the 10 p.m. push happens — and a metal rail nobody had planned for.
11 September 2026robot success rateReading robot success rates honestly: what 45.7 percent floor pickup means for a shift plan
Google published per-task success rates alongside its new models. They are strong research results and they are not shift ready for every task. Telling those apart is a numeracy problem, not a robotics problem.
30 July 2026ai robot operating costsAI Robot Operating Costs: ROI and Operational Efficiency
The introduction of AI-supported robots often fails due to unforeseeable operating costs and lengthy planning phases. Learn how werob delivers calculable results through hardware agnosticism and direct integrations.
11 June 2026operating system for physical workThe operating system for physical work: routing one job across agent, robot and person
Field software models one kind of worker: a person with a van and a time slot. Three now share the same job list. What changes in dispatch, safety and measurement when the cheapest qualified resource is a machine.
29 July 2026